

Overview

HOW IT WORKS


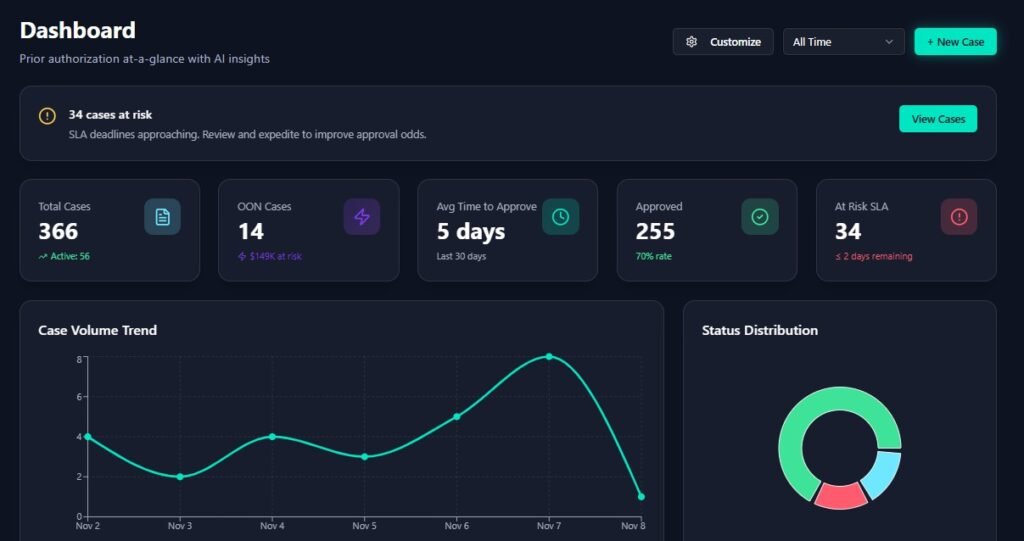
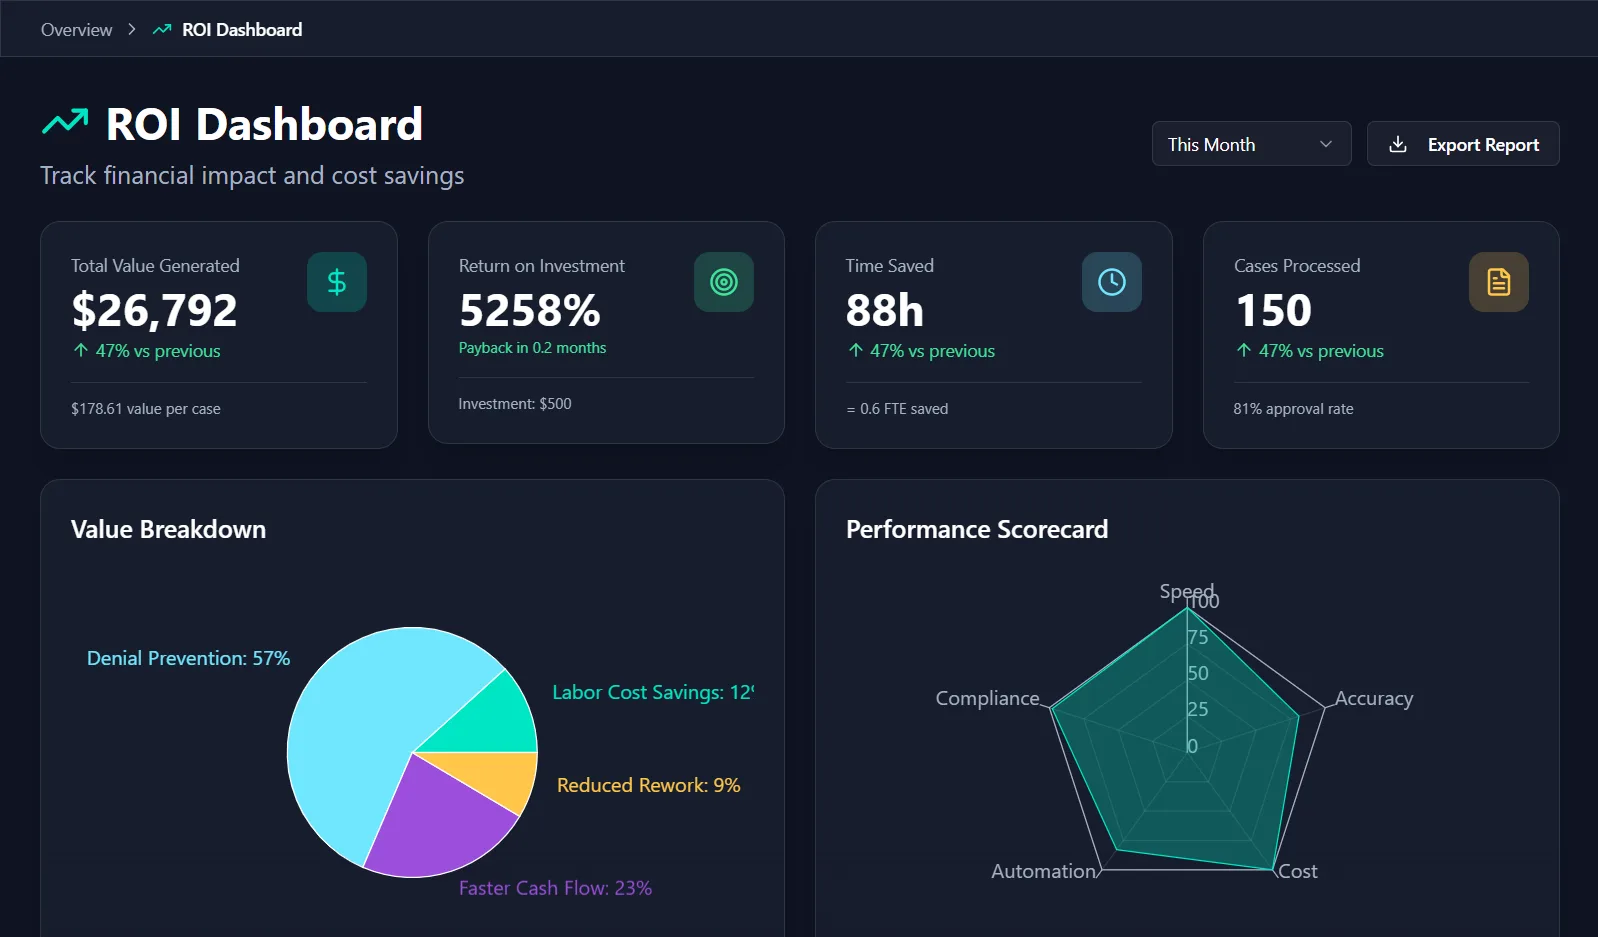
Executive Dashboard
High-level KPIs and trends including overall approval rates, authorization volume trends, revenue impact, team productivity, and month-over-month comparisons.

Manager Dashboard
Operational metrics for workflow optimization—team performance, queue status and backlogs, processing time trends, error rates, and resource allocation.

Clinical Dashboard
Provider-focused metrics including personal approval rates, pending authorizations, urgent cases requiring attention, documentation quality scores, and peer comparisons.
Payer Relations Dashboard
Relationship management insights—payer-specific performance, communication history, contract compliance, negotiation leverage points, and relationship health scores.
HOW IT WORKS